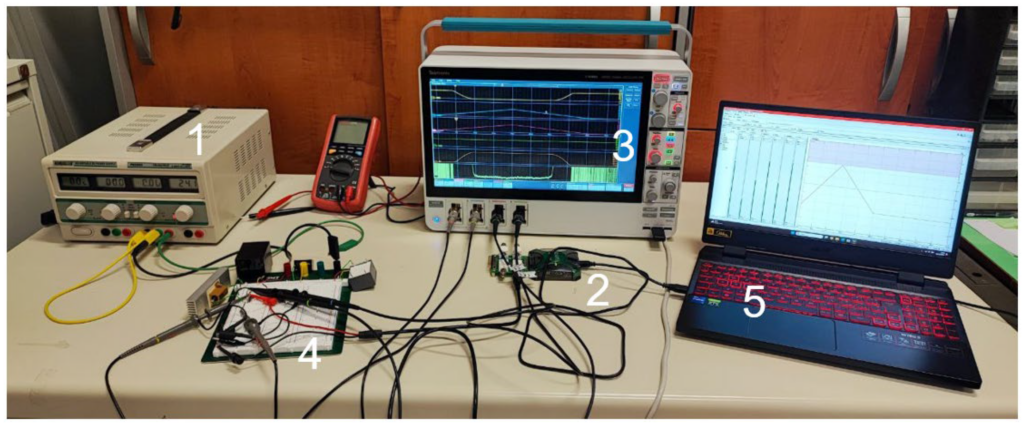
Photo: academic setup used by Pasquale Cusumano, Flavio Vella and Alessandro Sirchia to study charge trapping in gallium nitride transistors with triangular gate-voltage pulses, shown for context only; it is not a ChinaSemiOps or Innoscience laboratory. 1 power supply; 2 programmable board; 3 oscilloscope; 4 test circuit and probes; 5 control computer. Figure 3, Electronics 14 (2025), article 1991, © 2025 the authors, Creative Commons Attribution 4.0 (CC BY 4.0), reproduced without cropping or retouching. Published 13 May 2025; capture date unknown.
Imagine comparing two GaN (gallium nitride, a semiconductor material) FETs (field-effect transistors, switches controlled by an electric field). Both datasheets list the same RDS(on) (drain-to-source on-state resistance, the resistance between those terminals while the device is on).
Each supplier also gives a GaN dynamic on-resistance result: the on-resistance measured after a stated stress or switching history, at a stated observation time. Can those results go side by side? First check the static reference—the baseline resistance obtained under a stated static measurement protocol and temperature.
A useful comparison needs both the result and the conditions. The six questions below help you separate the possible causes of a difference and decide what evidence to request.
Three takeaways
- A dynamic-to-static resistance ratio is comparable only when its reference, temperature basis, stress history, observation timing and extraction method (how resistance is derived from the measurements) are stated.
- Temperature effects and charge trapping (carriers captured at defect sites in the semiconductor and released later, which is called detrapping) are different things. Keep them apart.
- A supplier’s platform-level monitoring disclosure does not by itself establish qualification of the specific part you plan to buy.
What a single resistance number leaves out
Read the stated conditions beside a datasheet RDS(on) value before using it as a reference. A GaN transistor can behave differently after it has been held off at high voltage or has been switched, because charge can be captured inside the material. Off-state stress is electrical stress applied while the device is commanded off. Its voltage and duration need to be disclosed.
Texas Instruments (TI) explains in its June 2021 technical paper SNOAA68 that trapped charge can reduce the charge carriers in the conducting channel and raise on-resistance. High off-state drain voltage, or hot carriers (carriers with unusually high energy) during switching, can cause trapping. As trapped charge is released, the device’s on-resistance changes; this is device recovery in this discussion. Use that explanation to investigate a resistance change while keeping temperature effects separate: it does not establish a common magnitude or recovery time for all devices, or show that every increase is caused by trapping.
Separate temperature from trapping
Temperature is part of the comparison, so a report has to say which temperature it means. Junction temperature is the operating temperature of the semiconductor inside the device. It is not automatically the case temperature measured on the package.
A June 2020 academic paper defines dynamic on-resistance relative to a direct current reference at the same junction temperature. Its authors note that normalizing—dividing the measured resistance by the reference resistance—against a room-temperature reference can combine the temperature-related resistance increase with the dynamic effect being examined. Ask how the junction temperature and reference resistance were established, and whether they represent the thermal state before stress or during switching. The historical framework helps frame that request; results for the present-day device still have to be supplied.
Stress history, switching conditions and observation timing
TI also describes continuous-switching testing, so stress history cannot be reduced to one blocking-voltage label (the voltage held off while the device is commanded off). Combining the TI and academic discussions, we recommend asking for that voltage and its duration, prior switching history, gate conditions (the drive settings at the control terminal), temperature and observation time.
Switching mode matters as well. In hard switching, voltage and current substantially overlap during a transition. In soft switching, the circuit is arranged to reduce voltage or current at the transition. Infineon describes a double-pulse test (a method that applies two controlled switching pulses) that can examine hard or soft switching, in a knowledge-base article published 18 June 2025 and updated 1 August 2026. The 2020 academic paper criticizes double-pulse characterization in the context it studied. Together these positions support neither universal acceptance nor universal rejection. Suitability depends on the question asked, the implementation and the operating history the test represents, and a double-pulse result is not automatically predictive of continuous operation.
Observation timing is another condition to compare. The device state can change after stress, so name the timing origin (the event from which the delay is counted) and the observation window (also called the measurement window, the interval used to evaluate readings). Instrument settling, the time the measurement chain needs to stabilize after a transient, is different from the device recovery described above. We recommend reporting both: recovery can continue within the observation window. The cited sources establish no universal numerical settling time or measurement delay, and waiting longer is not automatically more representative.
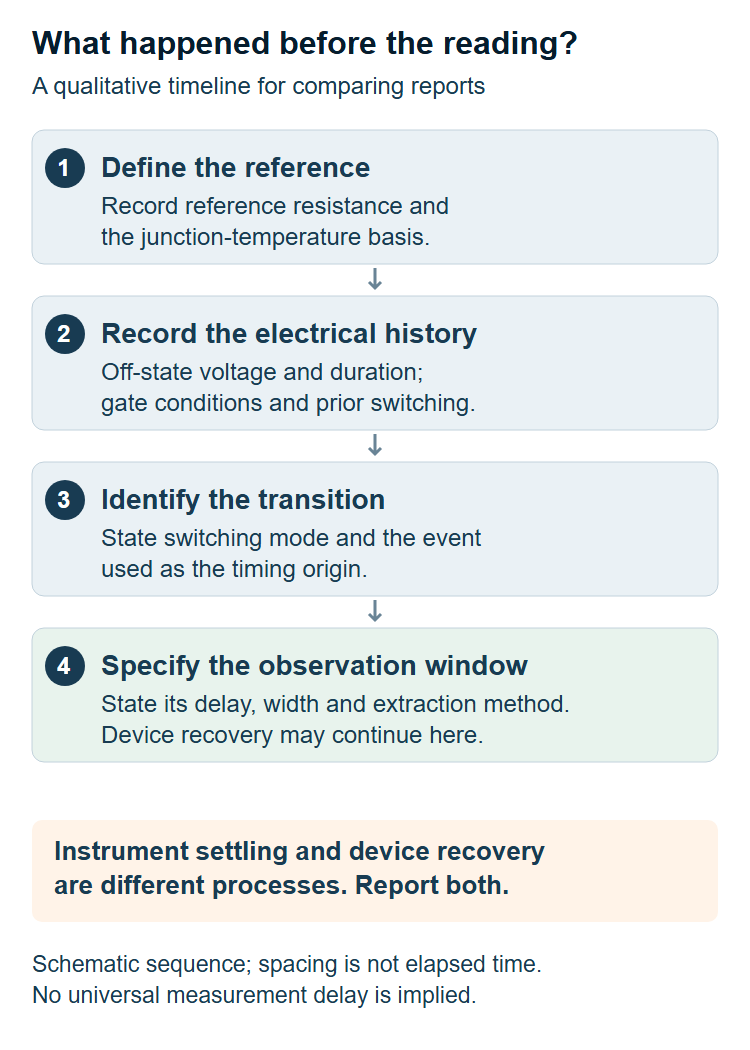
The extraction method deserves its own entry in the report. Infineon notes that voltage divided by current is undefined at zero current. It describes fitting current against voltage and using the inverse slope, meaning the reciprocal of the fitted slope. That applies to the described current-versus-voltage fit, not to any fit. Where fitting is used, ask which data range and time interval were fitted. Requests for that range, uncertainty (how uncertain the reported value is), settling evidence and sample dispersion (differences among samples) are our engineering recommendations, not requirements quoted from the sources.
What one China-based supplier discloses
Innoscience offers a bounded example. Its public reliability-monitoring page says it monitors across process platforms and manufacturing facilities each quarter, choosing the highest-volume product within a platform. Its program table lists dynamic on-resistance monitoring in the initial-batch and quarterly phases. The page is undated; we checked it on 1 November 2026. The company’s global-presence page states that Suzhou is its headquarters and a manufacturing site and that Zhuhai is a manufacturing site. That page is also undated and was checked the same day.
Read together, these disclosures suggest a practical follow-up: ask which platform covers your part, whether it was among the monitored products, and what limits and results apply (row 6). The pages do not identify where a particular test ran or provide all numerical acceptance limits and part-specific results; no independent site audit is presented here. Platform monitoring alone therefore does not qualify every device. This example is neither a supplier ranking nor an availability statement, and ChinaSemiOps does not claim to perform these measurements or have a relationship with the supplier. The worksheet applies to suppliers in any country.
Six questions for comparable evidence
Treat the table as an engineering recommendation, not a mandatory standard. Each row pairs a request with the limit on what the answer can support.
| Question | Evidence to request | Comparison limit |
|---|---|---|
| 1. Which device and static baseline? | Exact device identity and revision, sample scope, static reference protocol and normalization denominator. | Do not compare ratios with incompatible baselines. |
| 2. How was temperature normalized? | Junction-temperature basis, how it was estimated or measured, thermal history and reference-temperature matching. | A room-temperature denominator can mix thermal and dynamic contributions. |
| 3. What stress and switching came before the reading? | Blocking voltage and duration, prior history, gate conditions, frequency, hard or soft mode, and double-pulse versus continuous-operation context. | When histories differ, explain and account for those differences before comparing; neither method label universally predicts application behavior. |
| 4. When was it observed? | Named timing origin, observation delay, window width and position within the switching history. | Different observation times can represent different device states. |
| 5. How confident is the measurement? | Extraction method, handling of zero-current regions, fit range and time interval where fitting is used, settling evidence, uncertainty and sample dispersion. | Instrument settling is distinct from device recovery; fitting must match the stated method. |
| 6. What evidence covers this product? | Applicable acceptance limits, actual part-specific results and an explanation of how platform monitoring covers the proposed device. | A public platform-monitoring table is not qualification evidence for every part. |
Next action: send these six questions with the two datasheet numbers, collect the answers in one comparison sheet, and mark any blank as not provided rather than assuming the conditions match.
Selected sources
- Texas Instruments, technical paper SNOAA68 (June 2021): trapping mechanism, stress and timing. Cited as observed; not claimed to be the latest edition.
- IEEE Transactions on Power Electronics 35(6), 5581–5588 (June 2020), DOI 10.1109/TPEL.2019.2955656: Dynamic On-Resistance in GaN-on-Si HEMTs: Origins, Dependencies, and Future Characterization Frameworks (HEMT: high-electron-mobility transistor, the GaN transistor type studied; GaN-on-Si: GaN grown on a silicon substrate, with Si meaning silicon). The hosted copy’s cover text conflicts with the article’s publication identifier, so cite the journal details above.
- Infineon community knowledge-base article, published 18 June 2025, page updated 1 August 2026: Measuring dynamic RDS(on) of GaN FETs for soft-switching operations. The update date does not show a technical change.
- Innoscience, reliability monitoring (undated; checked 1 November 2026): vendor disclosure.
- Innoscience, global presence (undated; checked 1 November 2026): vendor-stated locations.
Please link to this article when sharing. Contact us for permission to republish the full article.